
Before we begin, I want to set stage clear – I am a Salesforce Dev by Trade with experience on Flutter and Adonis on the Side, so getting ML Contribution was a crazy daunting idea, but never the less, was worth a try.
As they say, where there is a will there is way.
And trying to make best out of a situation, I tried remembering the connects whom I have met ever, heard from anyone, and narrowing down to the most aligned and most possible to assist in the moment.
After a few mins of thinking, remembered of Sayak Paul, a well honored expert in the field whom I had the priviledge to meet years ago, but being Naive I never got in talks much.
After a quick conversation, he gave a piece of advice that was a common reminder I heard across industries – Just contribute to OSS and it will work out fine.
Being the paranoid exploring, the ifs and buts were about to take me down, but when asked for more detailed steps, he mentioned something that completely shook my head to calm down, he said – ?
“if you’re serious enough and you have clarity about what you want to do, you will figure it out.”
Those words, changed something deep, and there on the story begins!
Being a 2026 Gentleman Developer, Claude Tab was opened, did brainstorming, and explored some repos, found out a issue with flag good first issue in huggingface/peft repo.
The task
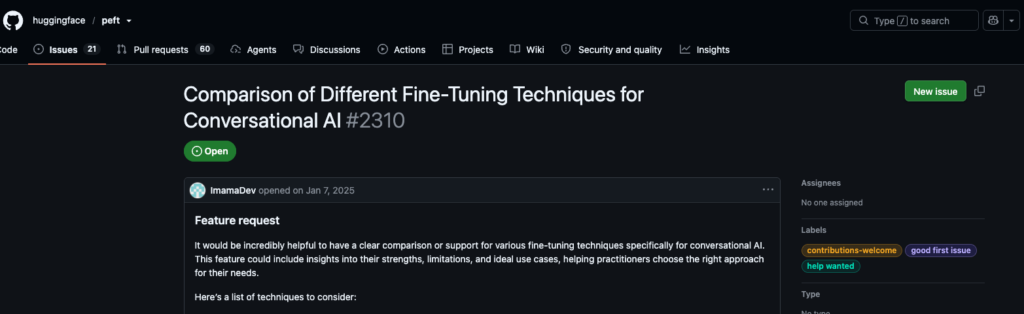
I picked up an open issue on Hugging Face’s PEFT library (#2310) — a community effort to benchmark different fine-tuning methods (LoRA, VeRA, DoRA, and others) on standardized tasks. My slice of it: run VeRA (a rank-based adapter method) at different rank settings on an image-generation benchmark, and see if any rank beat the existing default (r=32).
Simple in theory. One hyperparameter, one metric, one comparison.
(That’s what I believed what I was signing up for atleast)
Where it actually went
The hardware wall came first. My initial plan was to run this locally — a 4GB GPU. The PEFT maintainer, Benjamin Bossan, was direct about it: not enough VRAM, and using a smaller model to compensate would break the whole point of a fair comparison, since you need the same base model across all runs. His suggestion: free Kaggle GPUs (16GB tier). That became the actual setup.
Then a real bug showed up — and it turned out the “hardware wall” wasn’t really a hardware wall at all. Even on a 16GB Kaggle GPU, VeRA rank64 hit a CUDA out-of-memory error — not during training, but during a prompt-embedding precompute step, where the model transformer and the text encoder both needed to be resident on the GPU at once. Batch size didn’t matter. Alloc-config tweaks didn’t matter. Benjamin later confirmed the workload should have stayed well under 12GB, and that any PEFT method — not just VeRA — would have hit the same wall. It was a structural memory bug in how the benchmark script sequenced model loading, not a hardware limitation on my end. He opened a fix (PEFT #3395) within about a day — still open and awaiting merge as of this writing.
I reported it. Benjamin investigated on his end, found the root cause, and opened a fix upstream (PEFT #3395) within about a day. That fix is now sitting in the codebase because of a bug report that came out of a failed Kaggle run — not because I wrote clever code, but because I was patient enough to isolate where it broke and report it clearly.
Then a second, weirder problem. After the fix landed, my r=16 run trained at roughly 4x the speed of every other run I’d done — projecting close to an 8-hour total runtime instead of under 2. Benjamin couldn’t reproduce it on his own hardware. It happened again on a retry. To this day, the cause is unconfirmed — most likely something specific to shared, free-tier Kaggle GPU infrastructure, not the method itself. I reported that too, as its own data point.
Then the results themselves were unglamorous. Here’s the actual comparison, batch size held constant across all three:
| Rank | DINOv2 similarity ↑ | Drift ↓ |
| 32 (default) | 0.6627 | 0.231 |
| 64 | 0.6469 | 0.2272 |
| 16 | 0.6504 | 0.2368 |
No rank variant clearly beat the default. Rank 64 nudged drift down slightly. Rank 16 landed in between on similarity but was worse on drift. In short: the default was fine all along.
Why the boring result still mattered
Benjamin’s team maintains a dataset specifically for this kind of outcome — peft-internal-testing/benchmark-graveyard — a place to document experiments that didn’t improve on the baseline. The logic: someone else will eventually wonder “would a higher VeRA rank help here?” and now there’s a real, documented answer instead of them re-running the same experiment from scratch.
I submitted both non-improving results there as PRs. Neither one “wins,” and that’s exactly the point.
What I’d tell someone trying to do the same thing
You don’t need a research background, but you do need patience with slow, uncooperative infrastructure. Almost none of this week’s real value came from writing novel code. It came from actually running things and watching them fail instead of assuming they’d work, reporting failures with enough detail — the exact error, the exact step, what I’d already tried — that a maintainer could act on it immediately, and asking before doing anything big rather than guessing at scope.
A “my hardware isn’t enough” moment is worth investigating before you accept it. I assumed the OOM was a limitation of my setup. It wasn’t — it was a real bug in how the benchmark script managed GPU memory, one that would have hit anyone on any PEFT method. The lesson isn’t “free GPUs are secretly fine,” it’s “don’t assume the wall is about you until you’ve actually looked.”
Negative results are not failed contributions. I went in expecting to prove some hyperparameter tweak “worked.” It didn’t. What mattered was the process being clean, well-documented, and reproducible enough that someone else could trust the conclusion — that, plus a real bug caught along the way, which turned out to matter more than the hyperparameter result itself.
You can start a run and just walk away — Kaggle doesn’t need you watching it. Use “Save Version” / “Save & Run All” instead of running cells live in an interactive session. It kicks off as a batch job on Kaggle’s servers, fully independent of your browser — close the tab, close the laptop, go to sleep. The run doesn’t consume any less GPU quota by you staying up to watch it, so there’s no reason to. I learned this the hard way after a few too many late nights babysitting a training loop that was going to take exactly as long whether I stared at it or not.
Hope all this helps another friend in need who might be at the step I was at before getting started on this path.
Looking forward to more such experiences and writing about them to share with you too! Thanks for reading, dear builder 🙂
Update to the story –
Later finding something more to fix, I found out that the errors I received can be made a fix for others and raised PR for it (after discussion with Benjamin) and here we are, indirectly first Open Source Contribution Done!
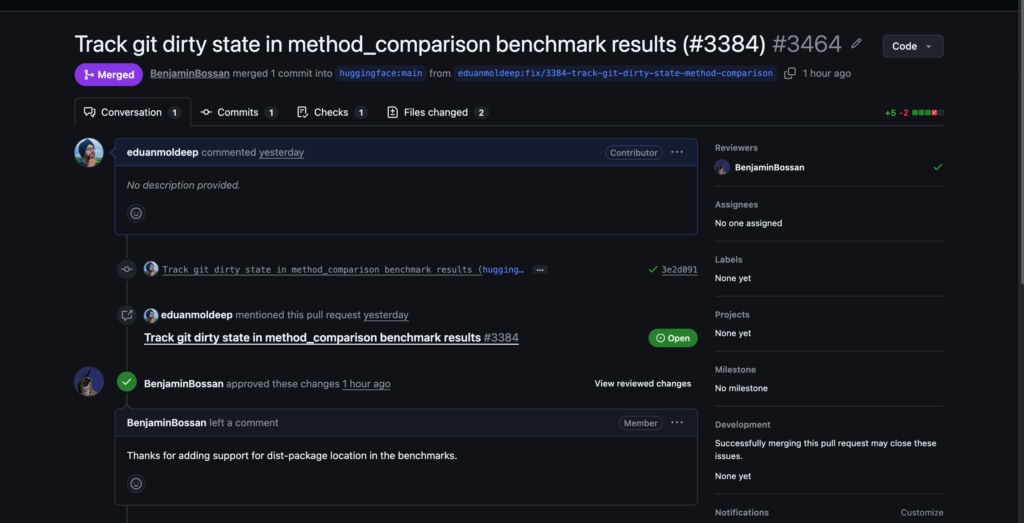
Big Happiness Unlocked! 😀